
Executive Summary: Warren Buffett is holding records amount of cash. Meanwhile, households are holding near record LOW levels of cash and near record high levels of stocks.
Last week we learned Warren Buffett’s Berkshire Hathaway set another new record for the amount of cash and short-term investments (e.g. U.S. Treasurys) its holding. Specifically, Berkshire is holding over $128 BILLION of cash and short-term instruments. That’s a lot of dry powder!
The reason he’s holding so much cash is because he hasn’t been able to find attractively-valued investment opportunities. So, like any disciplined investor, he’s not chasing obscene valuations. Successful investors don’t get caught up in the emotions of manias and bubbles. Successful investors also don’t let fear prevent them from buying good assets when they’re priced right much like Mr. Buffett was doing in early-2009 when everyone else thought the world was ending.
Last week, I also happened to come across some charts from @SentimentTrader (Twitter) showing how households are currently invested. There is some really interesting data here that presents a stark contrast to Mr. Buffett’s approach right now. Before we continue, remember Mr. Buffett’s wise words, “Be fearful when others are greedy and greedy only when others are fearful.”
First chart shows the amount of stocks households own as a percentage of their total assets. You’ll notice households’ stock exposure is back to levels only seen twice before: (a) at the turn of the century around the peak of the Dot-Com Bubble and (b) in the late-60s before the stagflationary 70s that included about a 13-year period where U.S. stocks went nowhere.

Households’ exposure to stocks is alarmingly high relative to the amount in money market funds (cash equivalents) blowing away any precedent for at least the last thirty years.
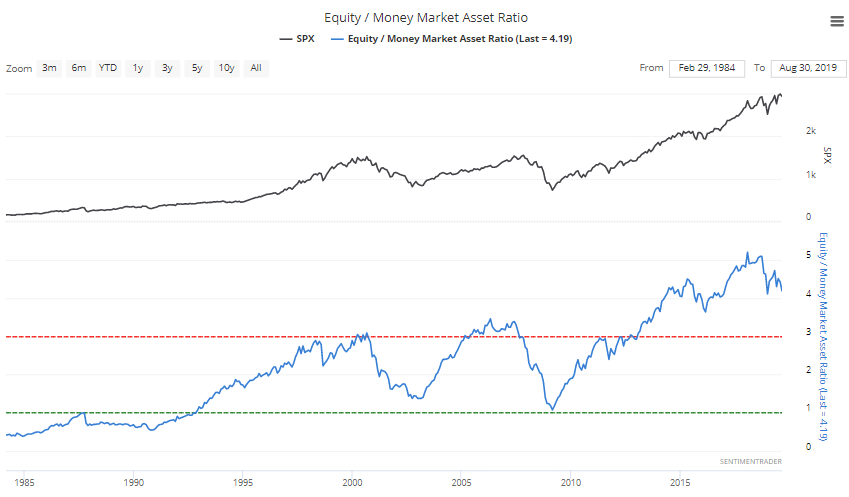
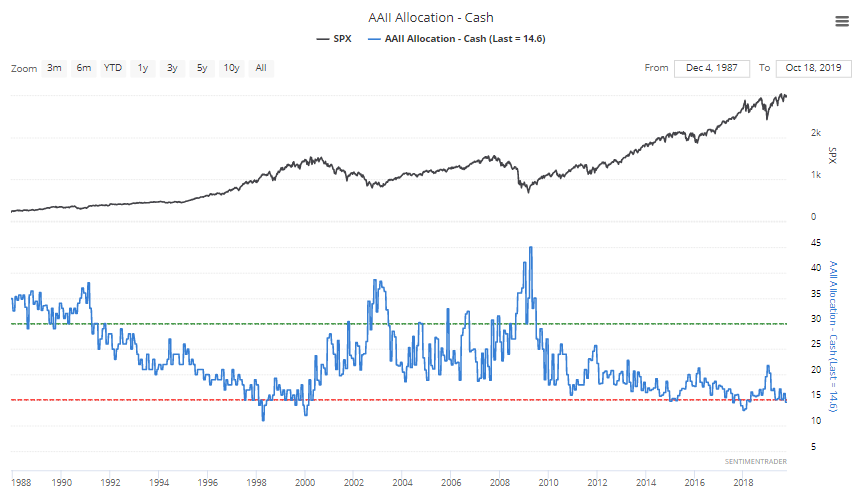
Individual investors have a frighteningly small amount of cash reserves (makes sense since they’re all loaded up on stocks). The question is, who has the cash? After all, if a household buys a stock typically they’re buying that stock from someone who is selling the stock meaning the cash simply changes hands (i.e. the cash doesn’t disappear).
I do believe the low cash reserves on households’ balance sheets are largely a function of financial suppression from the Federal Reserve. In other words, by keeping rates at zero for so long the Fed pushed many people into riskier assets (e.g. stocks, high yield bonds, real estate) than they’d normally hold if cash was providing a “normal” market rate of interest. Which is why, last week, I said the Fed is responsible for creating this bubble.
Households’ Cash below…
Of course, this is all the result of investors being extremely “complacent about near-term volatility prospects.” This complacency rivals that of last January and September before two decent selloffs of 10% and 20%.

Household net worth as a percentage of disposable income is at about “700% vs. 650% in 2007 and 615% in 2000…” – Peter Boockvar This is another dependably mean-reverting statistic.

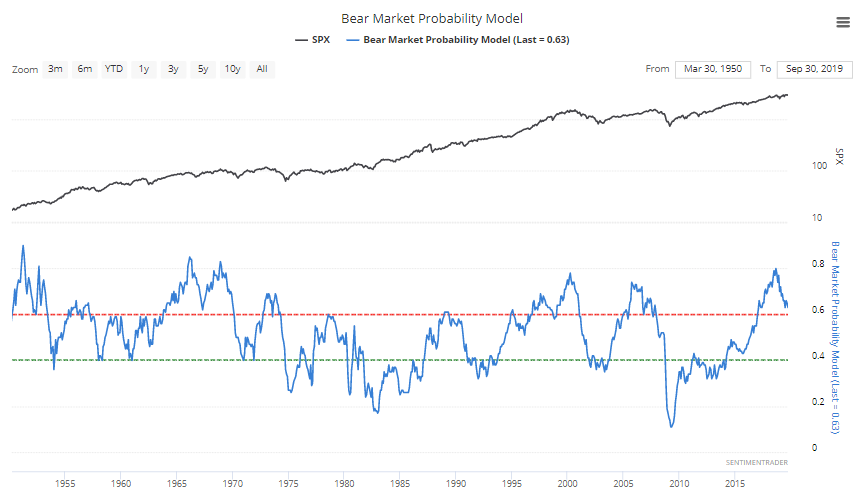
What does it all mean? The probability for a bear market hit 80% this year exceeding the probabilities at both the Dot-Com Bubble and Housing Bubble peaks! Investors are going to be tempted to chase this market higher but history has shown that to be a very bad idea as returns have often been promptly erased in a matter of months or even weeks. We just never know where that ultimate peak is and when that correction begins. However, when it begins it’s usually quite sharp and swift.
So, in the spirit of Mr. Buffett’s sage advice, do you think investors are fearful or greedy right now?
Disclosures:
Past performance is no guarantee of future results. All investments maintain risk of loss in addition to gain.
Data from third-parties is believed to be reliable but accuracy is not guaranteed. Much of the data used to interpret the markets and forecast returns are often at odds with each other and can result in different conclusions. Many different factors impact prices including factors not mentioned here.
This is NOT investment advice but merely a general commentary. Individualized investment advice cannot be provided until a thorough review of your unique circumstances and financial goals is completed.
