
I just wanted to share a few charts that do a great job putting the current market environment in perspective.
First, this is the price-to-sales ratio of U.S. tech stocks from Jeff Weniger rivaling that of the Dot-Com Bubble mania.
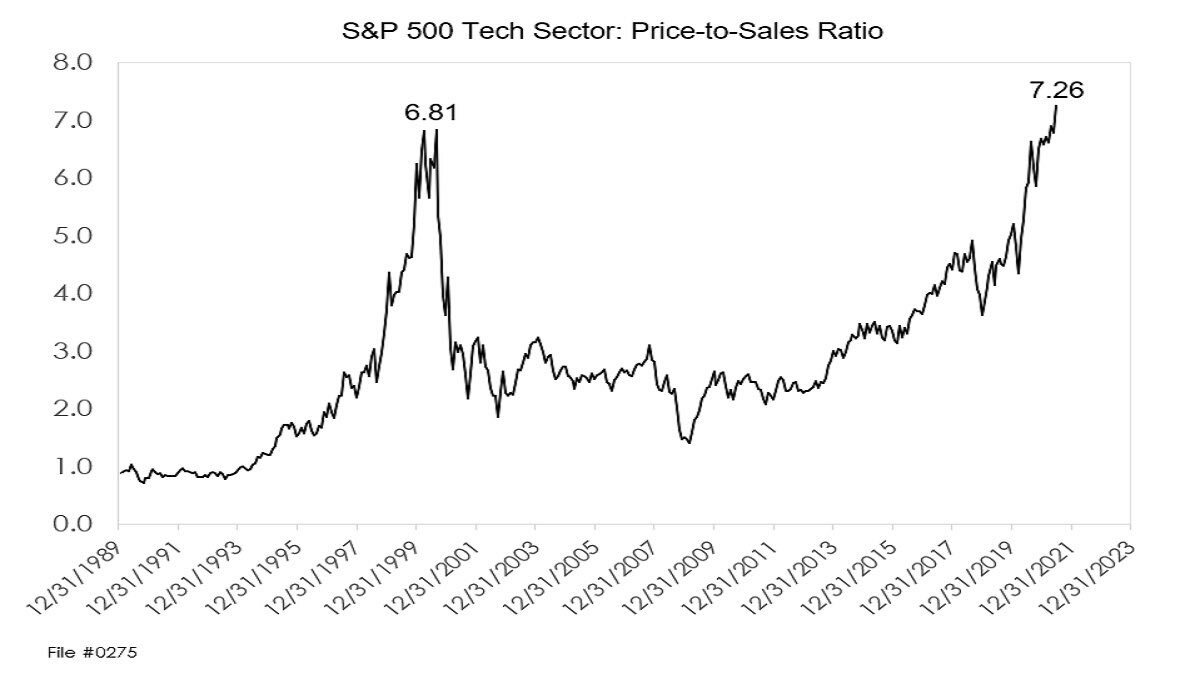
Mr. Weniger also shared that at his last count there are 75 stocks trading at over 10x sales! For perspective, at the peak of the dot-com bubble mania there were just 29 trading over 10x sales.
Liz Ann Sonders shared the price/sales ratio of the broader S&P 500… “S&P 500 price/sales ratio has notched a new record high (3.12) … well above long-term average (1.55) and 5y average (2.26).”

The S&P 500 recently closed at another all-time high but with less than 50% of S&P 500 stocks closing above their own 50-day moving average. This has now happened on 9 occasions since 1990…

As investors continue to chase yield regardless of “quality”, they’ve pushed junk bond yields below the rate of inflation for the first time in history…

“Since the end of March, almost 100 unprofitable U.S. companies, including GameStop Corp. and AMC Entertainment Holdings Inc., have raised money through secondary offerings, twice as many as coming from profitable firms… During the past 12 months, almost 750 money-losing firms have sold shares in the secondary market, exceeding those that make profits by the biggest margin since at least 1982″

Your investment strategy should be driven by your personalized, comprehensive financial projections that account for your unique circumstances to help you achieve your most important financial goals and grounded in time-tested investment principles.
Those financial projections should incorporate realistic 10-12 year return assumptions and include market stress tests to account for historically-low bond yields (low projected bond returns) and historically-high stock valuations (low projected stock returns) and the asymmetric risk/reward profile provided by each at the current moment in time.
Disclosures:
Past performance is no guarantee of future results. All investments maintain risk of loss in addition to gain.
Data from third-parties is believed to be reliable but accuracy is not guaranteed. Much of the data used to interpret the markets and forecast returns are often at odds with each other and can result in different conclusions. Many different factors impact prices including factors not mentioned here.
This is NOT investment advice but merely a general commentary. Individualized investment advice cannot be provided until a thorough review of your unique circumstances and financial goals is completed.
Views provided here are current only as of the moment of posting and are subject to change at any time without notification.
