
Friday’s 666-point decline puts the Dow back at levels not seen since…January 11, 2018!
*|Note the sarcasm|*
While a 666-point drop is extremely rare, although soon to become less rare, it’s merely a blip on a long-term chart. A 666-point decline represented about a 2.5% loss on Friday, which is far more common. A 600+ drop in the market has only happened eight other times while a 2.5%+ daily decline has happened 398 times (or about 1.8% of all trading days) since 1930.
What bothered me about last week is not that stocks lost ground, but how badly bonds got beat up. Even high-quality Treasuries didn’t protect against losses in stocks, which is one of the reasons for owning bonds in the first place. Although, I eventually believe there could be a “flight to quality” back to bonds when stocks really start getting beat up, there is no telling how high interest rates will rise (or how much bonds will lose) before that happens.
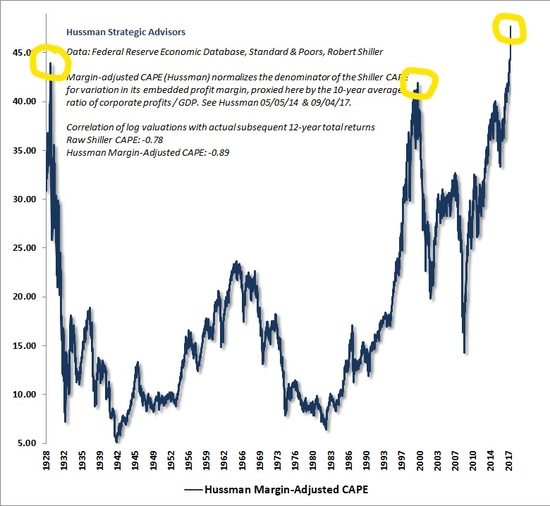
In any case, this is not the ultimate correction we need to fear. Current U.S. stock market valuations exceed prior records set in 1929 and 2000 and indicate the next bear market could produce staggering losses potentially in excess of 60%. A 60% decline from here would bring the Dow back down to $10,200, a level last seen in August of 2010!
Last week’s loss could simply be a blip on the way to new highs or could be the beginning of the next bear market. You never know until it’s well in the rearview mirror. Although we can be confident that valuations and other metrics are at historical extremes, it’s extremely difficult, if not impossible, to predict when the market will peak and at what level.
Let me know if you’d like a complimentary portfolio analysis. In the analysis I review investments, risk, allocations, and expenses and then provide specific recommendations on how we might improve the portfolio, lower expenses, optimize for taxes, etc….
P.S. Want to see current stock market valuations in a historical context? Here you go. A chart from John Hussman showing the Margin-Adjusted CAPE, which has about a 90% correlation to subsequent 12-year stock returns.
This is not intended as individualized investment advice but as education. Past performance is no guarantee of future results. See Disclosures
