Load up on stocks when they’re cheap. Reduce stocks when they’re expensive. It’s really quite simple.
Valuations tell us how expensive or cheap stocks may be, but beware! There are many different measures of valuation so it’s important to focus only on those that are highly correlated to future returns.
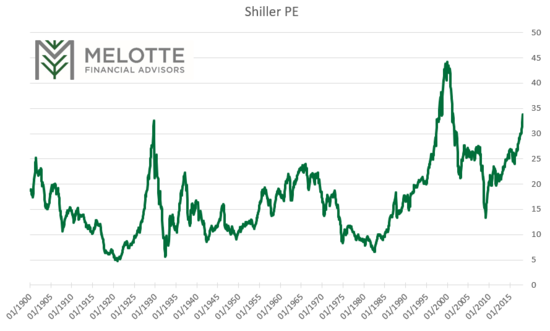
Below is a chart showing one measure of market valuations going back to 1900. This particular valuation metric is called the Shiller Price / Earnings Ratio, or “Shiller PE” for short. The Shiller PE has about a 90% correlation with future 10-year returns. That’s a very respectable correlation and indicates reliability.
Notice the peaks and valleys? I was curious to know how the market performed following various extremes over time to see if the Shiller PE provides useful information. So I performed a brief study. Check out the results…
It turns out, not surprisingly, that returns are extremely low for the 10-year periods following peaks and extremely high for the 10-year periods following troughs.
There have been four peaks since 1920 (not including the current one). The average 10-year cumulative price return from each peak has been about a 21% loss! Compare that to an average 84% gain for all 10-year periods since 1900. Clearly, stock market returns from points of extreme valuation are significantly worse than average.
There have been four troughs since 1920 as well. The average 10-year cumulative price return from each trough has been about 168%! Compare that to the 21% loss following peaks and also compare that to the 84% average return for all 10-year periods since 1900. Clearly, stock market returns following troughs are significantly better than average.
This makes perfect sense. The more you pay today for a future cash flow (i.e. the higher the valuation) the lower your expected return and vice versa.
Conclusion In Plain English:
When the Shiller PE is very high, it has historically foretold very low returns in stocks over the next 10 years. Conversely, when Shiller PE is very low, it has historically foretold very high stock returns for the next 10 years.
Right now, the Shiller PE is the second highest it has ever been (even higher than the peak on the eve of the Great Depression). That implies very low returns in stocks for the next 10 years. Caveat: Valuations, such as the Shiller PE, are unreliable for short-term return forecasts!
If the historical relationship holds true again, it implies investors should be under-weight stocks relative to their long-term target. What does this mean?
Well, assume your long-term target to stocks is 60% of your portfolio. Being under-weight would mean you may want to consider targeting about 40%-50% to stocks now rather than 60%. Then, when the next bear market hits and valuations are more reasonable, look to over-weight stocks by increasing that target to 70% or even 80%. This is all dependent, of course, on your unique circumstances, financial projections, and risk tolerance. Nothing should be done without first consulting your advisor and your stress-tested financial projections.
Contact me to learn more, help develop your long-term targets and build a custom investment strategy optimized for your unique circumstances.
Past performance is no guarantee of future results. This is intended as general education ONLY. Not individualized investment advice. Data from sources believed to be reliable but accuracy cannot be guaranteed. All returns listed are price returns and exclude dividends.
Don’t do anything without first consulting me or your financial advisor!


