
They say to “buy and hold,” but is that really the best approach? I don’t believe it is for many people. Let me explain why…
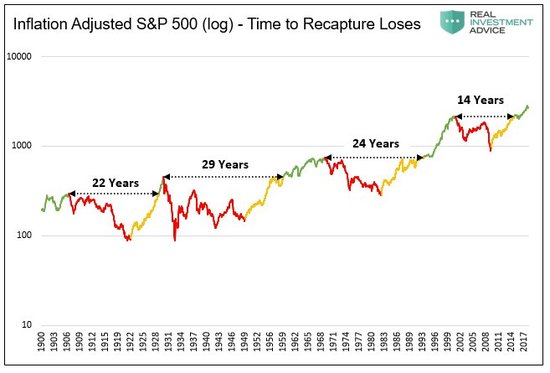
Below is a fantastic chart from Michael Lebowitz. The chart shows how long it took an investor to regain their purchasing power after major U.S. stock market peaks going back to 1900.
The time-frames to breakeven (net of inflation) have ranged from 14 to 29 years with an average of about 22 years! Think about that for a moment. Twenty-nine years is about as long as most people’s entire retirement!
If an investor retired sometime near a major market peak (1906, 1929, 1968, 2000) it’s possible their U.S. stock investments were still underwater by the time they died (net of inflation). These multi-decade periods of stagnation would have been exacerbated as a result of withdrawals from the portfolio to fund retirement expenses. Periods of stagnation robbed them of lifestyle or, worse, security in retirement.
So what do you do?
Well, it’s quite simple…don’t be overextended* in stocks near market peaks.
“Buy low, sell high” is a very simple concept. Most people understand the idea. The trick is figuring out what is low and what is high and then having the discipline to stick with your game plan even when it may not be working temporarily.
Here’s another great chart showing the Dow Jones Industrial Average since 1900 along with it’s long-term channel.
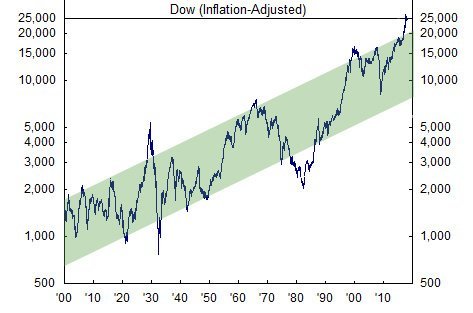
Notice how successful an investor would have been if they simply bought stocks when the Dow was trading near the bottom of its channel and sold stocks near the top of its channel?
Then notice where the Dow currently resides relative to its long-term channel…above the upper-end. Now find the other points in history when the Dow traded above the channel. Notice anything? Yep, those mark the other major market peaks discussed at the beginning of this letter (1906, 1929, 1968, 2000).
A 60% loss from the January peak would put us back near / below the low-end of the channel. Coincidentally, before I came across this chart, I was already expecting greater than 60% losses in the next bear market as a result of record high stock valuations.
So, based on this primitive analysis, do you think your portfolio should have more or less stock exposure at this point? How is your portfolio positioned? What approach are you currently taking? Are you in a position to take advantage of cheap asset prices when they present themselves or are you already over-invested in risk-assets and likely to be left holding the bag when losses accelerate?
It seems to me we’re at a point where investors with heavy exposure to stock and real estate assets might not make much headway over at least the next 10-20 years as a result of large losses in the interim. So the trick is to mitigate potential losses in the next bear market then use that value you will have preserved to buy up those assets when they’re cheap once again. THAT’s is how you can beat the market cycle.
Contact me to learn more about my financial planning and investment process. I’m also offering a complimentary reviews of portfolios to help identify total expenses and risk exposures.
A quick note on buy-and-hold: Investors still in the “meat” of their accumulation years can afford an aggressively-positioned buy-and-hold approach because they are dollar-cost averaging into the market throughout their working / saving years. However, folks who either cannot afford or tolerate significant market declines may need a more proactive approach or an approach that includes a plan to protect against downside risks.
Kindest Regards,
Ken
* “Overextended” is a relative term that has different meaning for each family based on their unique circumstances and can only be identified after robust financial planning.
Past performance is no guarantee of future results. This is not intended as individualized investment advice but only as general education! I am unable to provide specific recommendations until we complete your long-term financial projections, and I have a thorough understanding of your circumstances, investing knowledge, risk tolerance, resources, etc…
No single chart or data point should be relied upon for predicting future returns as there are many factors that influence asset returns.
