
I hope you and your families are staying healthy and have been able to get outside to soak up some sunshine!
Yesterday, the S&P 500 crossed above the 3,000 threshold for the first time since early-March. Unfortunately, it wasn’t able to hold that level into the close (closed at 2,991) although it’s making another run at it today.
The S&P 500 has now rallied about 34% from the March 23rd closing low. That means it needs about another 13% to regain the all-time high of ~3,386 (February 19th).
Looking forward to prospective returns for the S&P 500, we learned from Dr. John Hussman that current valuation indicates a negative return for the next decade.
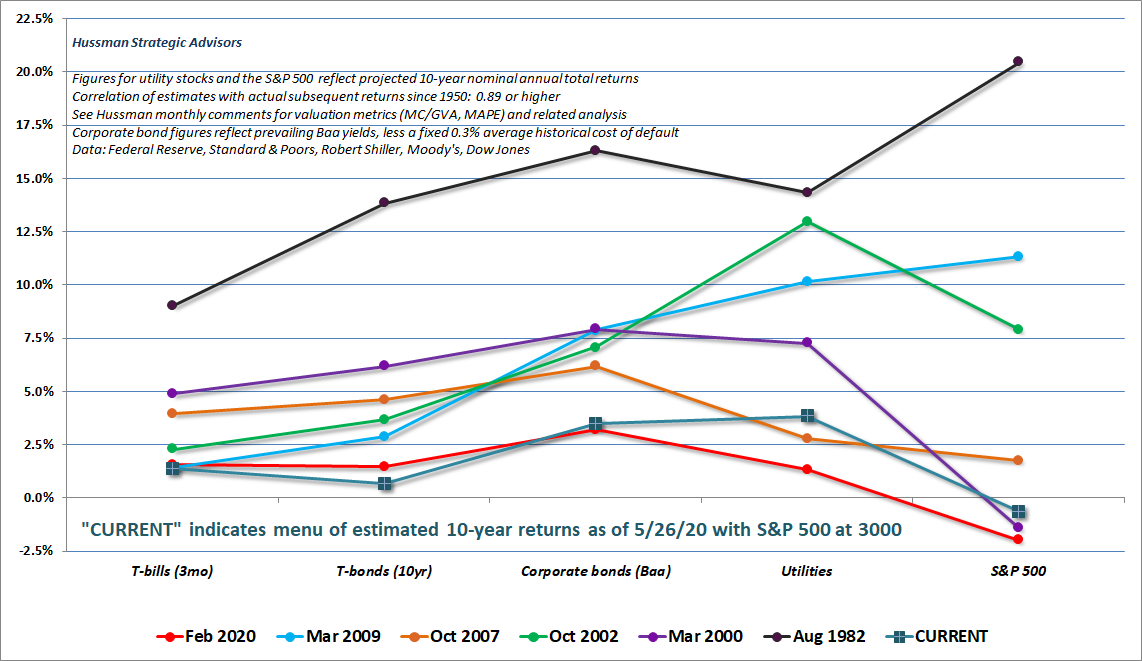
Specifically, “Based on valuation measures we find best-correlated with actual S&P 500 total returns across a century of history, today’s run to 3000 on S&P 500 brings likely 10-12 yr SPX returns to negative levels, and rival the 2000 and 1929 extremes.”
He provided us a chart with a menu of prospective 10-year returns for various U.S.-based asset classes. The chart also shows the projected returns from past periods for historical context.
We notice the highest projected 10-year returns were starting in August 1982, March 2009 and October 2002. Those were all after tremendously difficult periods for stocks and when S&P 500 valuations were far lower than the prior bull market peaks. The only worse return outlooks than today’s were from February 2020 and March 2000 at the dot-com bubble peak when S&P 500 valuations were also at historical extremes.
As far as shorter-term indicators go, I recently came across an interesting statistic from @SentimentTrader:
“Volume spiked in March and is now falling. SPY’s [S&P 500 ETF] volume is now -64% below its 3 month average, while the S&P is under its 200 dma. When this happened over the past 20 years, U.S. stocks ALWAYS pulled back over the next 2 months, sometimes *very sharply*”
Obviously, the past is no guarantee of the future when it comes to markets or economics but certainly a strong precedent to at least be aware of before going performance chasing.
Then, of course, we are simultaneously experiencing the sharpest job losses in history…38.6 million jobs lost in just 9 weeks with GDP expected to contract severely.

Based on current labor market stats and current estimates for GDP we’re essentially in a depression. Obviously, the market is pricing in a prompt return to normal and quick reversal as if we’re simply going to pick up where we left off in January. Valuations for the U.S. stock market were already extreme even without the pandemic and economic shutdown. Although, the pandemic and subsequent policy response certainly magnified and accelerated job losses and brought the economy to a screeching halt.
Additionally, corporate leverage was already at all-time highs combined with record low credit quality, which is why we’ve seen an acceleration of bankruptcies these last two months. There were many companies barely hanging on so there’s no way they could survive a multi-month forced shutdown. Unfortunately, there will likely be many more bankruptcies to come. We’re in an environment characterized by record high valuations and record high leverage with the potential for a cascade of defaults. Is it any wonder the Fed is printing trillions to backstop the market and provide liquidity? As I’ve said before, high valuations and extreme leverage is a dangerous combination because it implies any minor hit to revenue can lead to a cascade of defaults and sharp losses in stocks (much like we saw from February 19th to March 23rd). Therefore, we’re likely to see a lot more action from the Fed as well over the next twelve months.
I’ll leave you with this final thought. These are the returns by the nine decades since 1930:

When we overlay the best and worst three decades from above with their respective starting points on the valuation chart below we notice the obvious relationship between price and returns: The price you pay determines your return. If you pay a high price your return will be low. If you pay a low price your return will be high.
So do you believe today is more likely a generational buying opportunity or a generational selling opportunity?

Please note that the Fed could continue to print trillions in an attempt to inflate asset prices, which could throw a major wrench into the return projections but understand that the real (i.e. inflation-adjusted) returns would still be very low. In fact, it’s likely the Fed will respond to defaults and stalling markets with trillions more in liquidity, which is why I think it’s important to at least have some allocation to precious metals. Conversely, a debt deleveraging cycle caused by a cascade of corporate and household defaults could actually be DE-flationary initially before the Fed really ramps up its digital printing press, which means it may be important to incorporate appropriate deflation protection within portfolios as well. More on the deflation vs. inflation dynamic in a future commentary dedicated solely to that topic.
Disclosures:
Past performance is no guarantee of future results. All investments maintain risk of loss in addition to gain.
Data from third-parties is believed to be reliable but accuracy is not guaranteed. Much of the data used to interpret the markets and forecast returns are often at odds with each other and can result in different conclusions. Many different factors impact prices including many factors not mentioned here. Many factors are often contradictory.
This is NOT investment advice but merely a general commentary. Individualized investment advice cannot be provided until a thorough review of your unique circumstances and financial goals is completed.
Views provided here are current only as of the moment of posting and are subject to change at any time without notification.
