

The rally that began around Christmas Eve continued with strength through last week.
It’s been such a strong rally that U.S. large company stocks (as measured by the S&P 500 index) even eclipsed the prior record high from last September…admittedly, an event of which I was skeptical.
Specifically, on September 21st the S&P 500 set a new intra-day high at $2,940.91. However, last Wednesday the S&P 500 touched $2,954.13 before closing down to $2,923.17. As I write this commentary on May 6th, the S&P 500 is trading around $2,910.
Now, unfortunately, the S&P 500 was the only major index to set a new high. U.S. small company stocks (Russell 2000) are still down over 8% from their August 31st record. The global stock market more broadly, including foreign developed and emerging markets (MSCI All Cap World Index), is still down over 6% from it’s all-time high set almost 16 months ago on January 26th, 2018. Yes, the global stock market is still technically in a bear market.
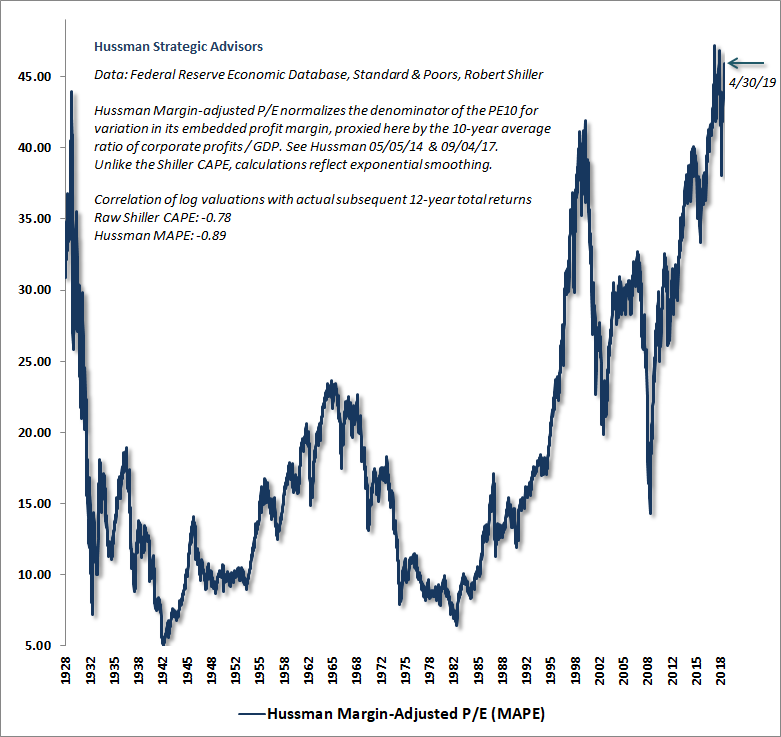
Here is the interesting part, when reviewing one of the most reliable valuations metrics available from John Hussman, we find that the U.S. stock market has experienced current extremes only two other times in history (1) 1929: on the eve of the Great Depression and (2) 2000 – on the eve of the Dot Com Bubble burst. Neither of those events ended well, and I don’t expect the current dislocation to end well either.
The base case is that the next bear market could produce losses in U.S.-based stocks exceeding 50%-60% just to bring valuations in line with more “normal” levels. That’s not to say that valuations won’t overcompensate and swing to an equally extreme cheap level on the way down much like a pendulum that swings from one extreme to another. Essentially, extreme valuations in the market can potentially indicate a lot of stored up energy implying losses that even exceed 60% once the cycle is complete…particularly in the most overvalued sectors.
Obviously, the past is no guarantee of the future. Additionally, the market could continue to rise further from here in the short-term, which would stretch valuations even further. But, still, I believe history could ultimately show this was a very poor time for investors to be overly aggressive with their investments.
So the question investors need to ask themselves at these extremes is, “What does a 50%-60% decline do to my retirement / financial goals / financial independence based on how my portfolio is invested today?” And the follow-up question, “Are there modifications I can make to my investment strategy that would better protect me and my family and our financial goals?”
These are obviously a few of the core questions I answer when building financial projections for clients as the process helps us identify an appropriate, prudent investment strategy that gives them the greatest probability of achieving their financial goals in a variety of market environments.
Here is the chart of U.S. stock market valuations going back to 1928, produced by Dr. John Hussman, one of the foremost leaders in valuations analysis.
Let me know if you or anyone you know could use help building out your financial projections to determine if you’re on the right path and appropriately invested.
Kindest Regards,
Ken
