
With the market’s momentum from 2019 continuing on into 2020 so far, I wanted to provide a valuation update. Please remember that valuations are not reliable at all for short-term market timing but are very reliable for subsequent 10-12 year return projections.
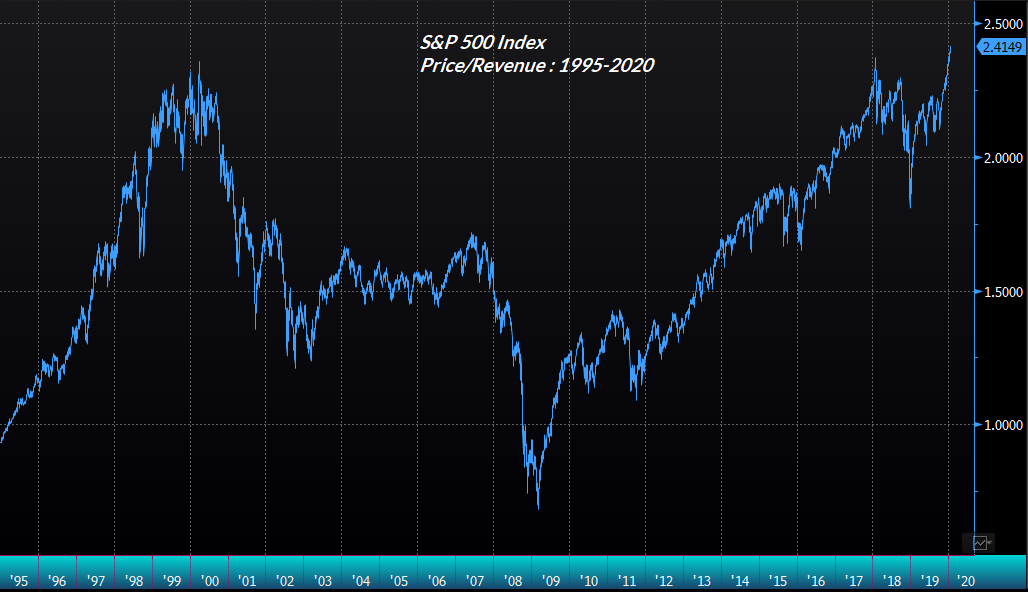
First, we have a couple price-to-revenue measures.
The S&P 500 Price/Revenue now exceeds that extremes of the 2000 Dot-Com Bubble.
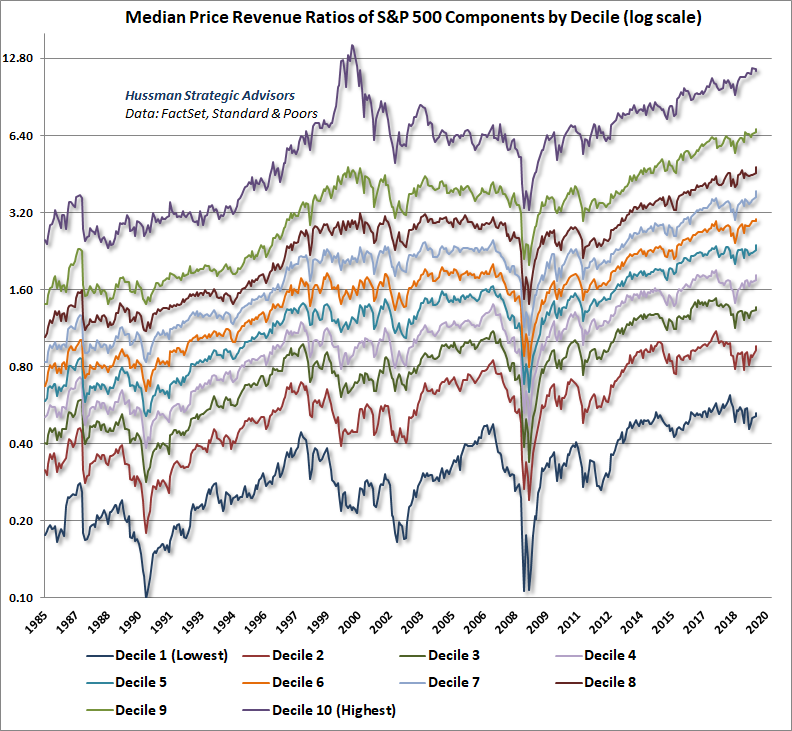
This next chart also shows Price/Revenue ratio but with a couple twists. The first twist is that it’s showing the median price-to-revenue ratio. The second twist is that it breaks the S&P 500 down into ten deciles based on valuations. As Dr. John Hussman said regarding this chart, “Another feature of the bubble here is its breadth. Except for the top decile [tech stocks], the other 90% are easily 10-50% beyond 2000 [levels].”
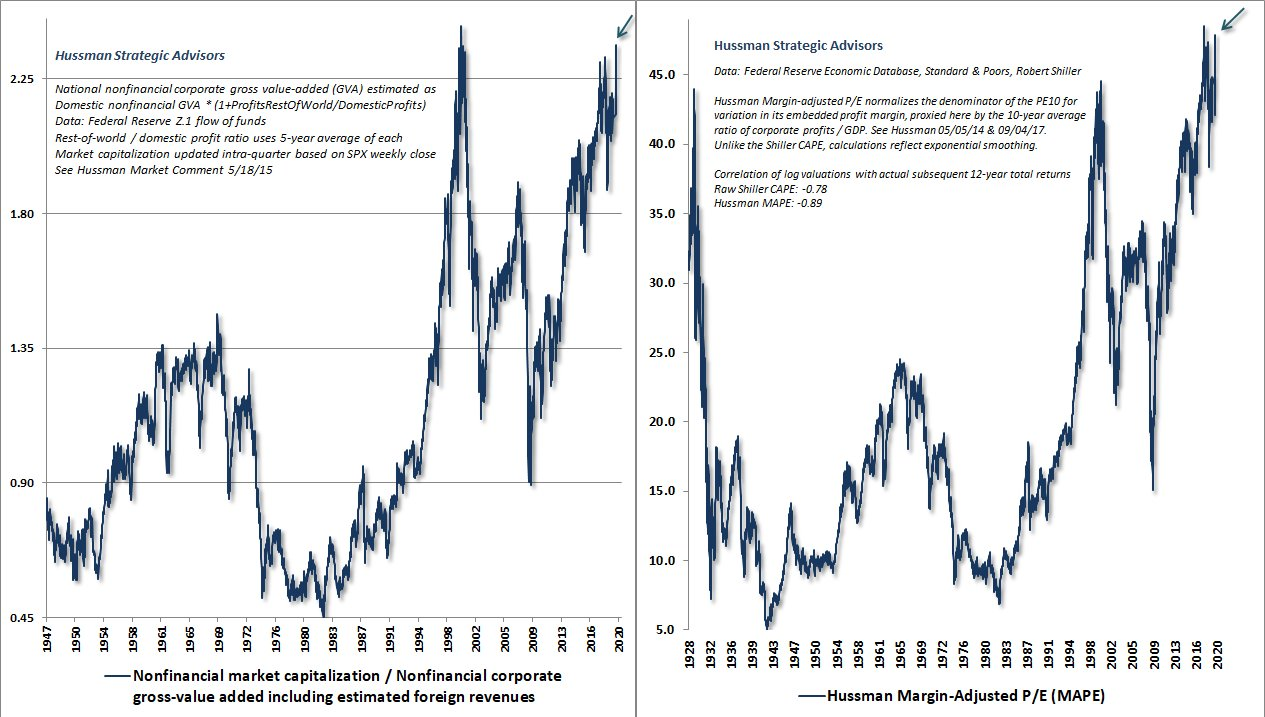
Below are two more measures from Dr. Hussman. By the way, the reason I use so much of Dr. Hussman’s valuation work is because he appears to have done the most extensive research on valuations along with their correlations to future returns so this way I’m assured of using only the most reliable valuation metrics as opposed to the more-commonly quoted P/E ratios that have relatively weak correlations to future returns.
In the case of both measures below, the current market is as overvalued, or more so, than both the 2000 Dot-Com Bubble and the culmination of the Roaring 20s just before the Great Depression.
“[The first chart] is the single most reliable valuation measure of scores we’ve studied or introduced (this in 2015). It would take a drop to 3,000 on the [S&P 500] to raise prospective 12-yr returns to 0.” – Dr. John Hussman (emphasis mine)
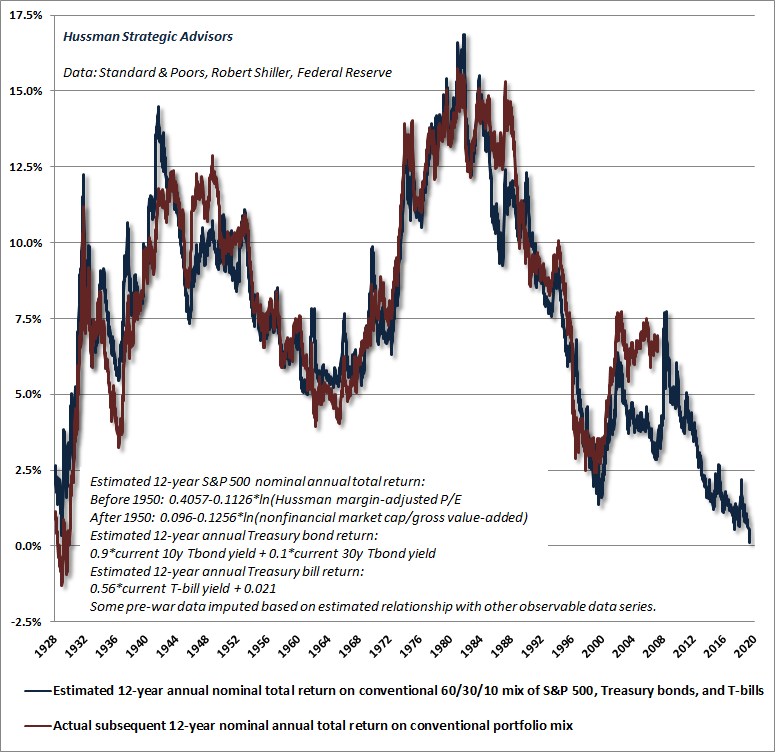
To understand why these metrics are important refer to the chart below that graphs both estimated 12-year annual returns of a static 60/30/10 portfolio AND actual 12-year annual returns. You’ll notice there is tight correlation over time although there are periodic discrepancies, but those discrepancies are quickly made up over the completion of the market cycle. The projected return of a static 60/30/10 portfolio from today is about 0.0% for the next twelve years.
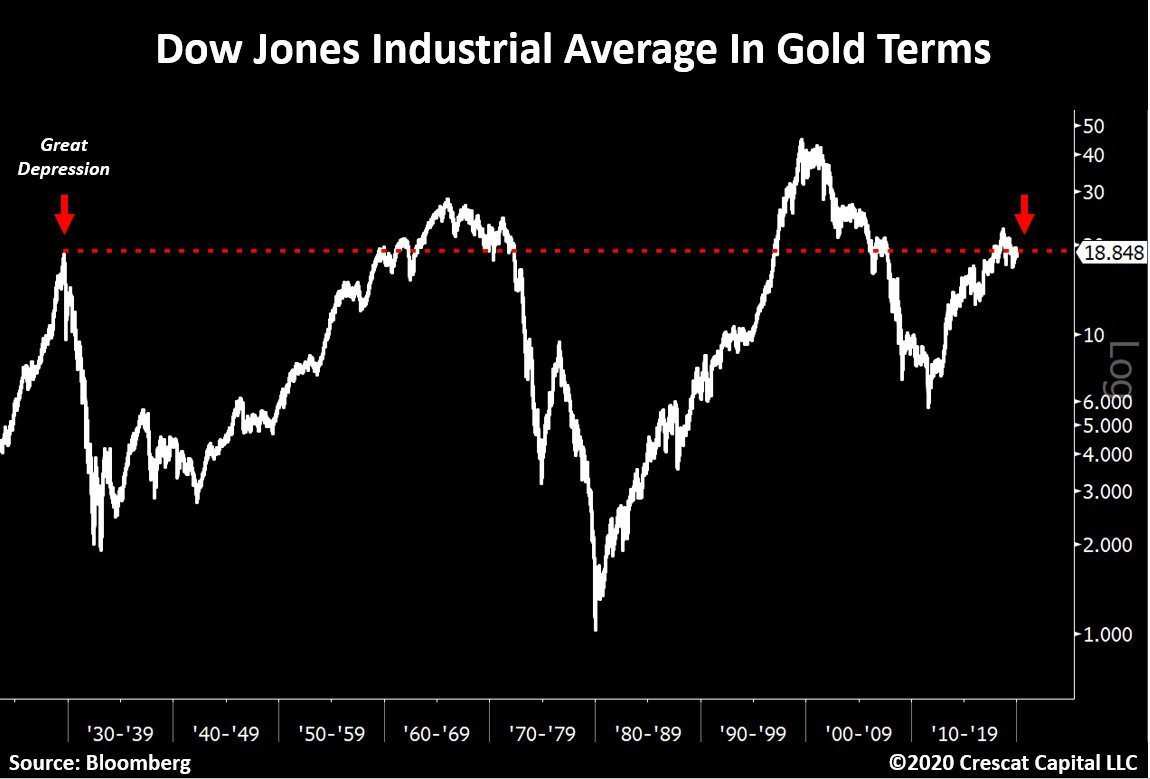
Here’s another interesting chart that measures the Dow Jones Industrial Average in terms of gold. In other words, how many ounces of gold does it take to buy one share of the Dow?
I like this measure because the Dollar’s purchasing power decreases overtime due to monetary inflation from the Federal Reserve so it’s helpful to measure assets in terms of hard money commodities to give a better feel of price and relative value over time. You’ll notice this ratio also has peaked at the end of every secular bull market/beginning of every secular bear market.
So, what does it all mean?
- A static portfolio, due to low interest rates for bonds and high valuations for stocks, will likely deliver very low returns over the next 10-12 years. This obviously is not a guaranteed outcome but a highly likely outcome based on both history and laws of economics. This is especially important to know (and incorporate into financial models/retirement plans) for people nearing retirement or who have recently retired. Why? Because their projections are likely overly-optimistic. Those last few working years, or first few retired years, are the most important in an investor’s lifetimes. Lower-than-expected returns during that 10-14 year period surrounding an investor’s retirement date can have a dramatic impact on their financial independence, retirement lifestyle, etc… Risk exposures should be managed appropriately.
- The next decade is not likely to be characterized by low, flat returns but more likely by a sharp decline/bear market and subsequent recovery. This will actually create opportunities for flexible investors. A more flexible, nimble approach may be required to navigate the next decade and potentially overcome the negative outcome described in point #1 above. A static portfolio may not be the answer for some.
- Certainly don’t chase performance higher at these nosebleed valuations! This means don’t increase your stock market exposure because you want to participate more meaningfully in the melt-up. The farther valuations get stretched the more violent the snapback. Investors likely will not have the time, or the discipline, to reduce risk before that happens. Chasing performance here is likely setting performance-chasers up for failure. It never fails at the end of the bull market –> People are somewhat cautious, the market continues to melt up, they throw caution to the wind and load up on more stocks (and usually low-quality stocks because those are the ones rising the fastest) and all of a sudden the market reverses significantly and sharply.
The only precedent we have for current extremes is 2000 and 1929. So let’s look at what some people were saying/doing then:
Probably one of the most famous “bagholder” bubble quotes was from Irving Fisher on October 16, 1929 —
“Stock prices have reached what looks like a permanently high plateau.”
The Dow proceeded to drop 11% just eight days later on Black Thursday, October 24, 1929, then fell another 13% on Black Monday the 28th and then another 12% the following day. The Dow proceeded to lose 89% from its ultimate peak through its ultimate trough. But that’s not all Mr. Fisher said. On October 21st he said the market was “only shaking out the lunatic fringe.” On the 23rd, one day before the 11% one-day decline, he said “security values in most instances were not inflated.”
I’m not intending to mock Mr. Fisher. He was a brilliant economist. But it goes to show even the brightest among us are not immune to the emotional rollercoaster and irrationality that plague most investors at market extremes. The bottom line is people get greedy (and think they are geniuses) at market tops and extremely fearful at market bottoms. Mr. Fisher wasn’t the only one. Here are some newspaper headlines from 1929:
“We will not have any more crashes in our time.” – John Maynard Keynes 1927
“I cannot help but raise a dissenting voice to statements that we are living in a fool’s paradise, and that prosperity in this country must necessarily diminish and recede in the near future.” – E.H.H. Simmons, President NYSE January 1928
“There will be no interruption of our permanent prosperity.” – Myron Forbes, President of Pierce Arrow Motor Car Co. January 1928
“There may be a recession in stock prices, but not anything in the nature of a crash.” – Irving Fisher September 1929
“This crash is not going to have much effect on business.” – Arthur Reynolds, Chairman of Continental Illinois Bank of Chicago October 1929
“We feel that fundamentally Wall Street is sound, and that for people who can afford to pay for them outright, good stocks are cheap at these prices.” – Goodbody and Co. market-letter October 1929.
And, of course, many, many more…
Looking back years later, Graham and Dodd made this observation about the period —
“An investment operation is one which, upon thorough analysis, promises safety of principal and satisfactory return. Had the same attitude been taken by the purchaser in 1928-1929, the term ‘investment’ would not have been the tragic misnomer that it was.”
Bottom line –> don’t chase returns or fall into the trap of thinking the laws of economics no longer apply or that “it’s different this time” because it’s likely not. Keep your wits about you. Think logically, rationally and employ common-sense. Try, as hard as it might be, to remove emotion from the investment decision-making process. This is especially critical if you’re near your retirement age, less critical if you’re a relatively young investor or even well into your retirement years already (depending on your unique circumstances of course).
Kindest Regards,
Ken
Disclosures:
Past performance is no guarantee of future results. All investments maintain risk of loss in addition to gain.
Data from third-parties is believed to be reliable but accuracy is not guaranteed. Much of the data used to interpret the markets and forecast returns are often at odds with each other and can result in different conclusions. Many different factors impact prices including factors not mentioned here.
This is NOT investment advice but merely a general commentary. Individualized investment advice cannot be provided until a thorough review of your unique circumstances and financial goals is completed.
