
It’s no secret that I have been concerned about both (1) our proximity to the next bear market and (2) the potential severity of the decline in the next bear market.
A tricky thing about bear markets, however, is that we can be in one for a long time before we even realize it. That’s because bear markets can only be confirmed in hindsight only AFTER losses have become sufficiently severe. That doesn’t do the “reactive” investor any good because by the time it is known we are in a bear market (or a recession) it’s almost too late to do anything about it. The only way to avoid being reactive is to be proactive, which can only be accomplished if you understand history and are able to pick up on meaningful signals through all the noise.
Before I get to a couple signals I’ve observed that have me concerned, allow me to illustrate my first point that you can be in a bear market long before the bear market is confirmed. Let’s step back in time to the tech bubble of 2000-2002.
Technically, the S&P 500 peaked in March of 2000 at 1,527,46 (closing high). And even though the market dropped over 11% from March 24th to April 14th, by September (over 5 months later) the S&P 500 was basically right back to where it was at the March 24th peak. See chart below.
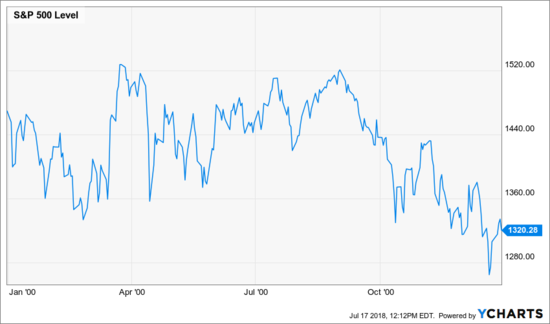
What’s even more interesting is that it was a full year after the March 2000 peak before a bear market was even confirmed!!
If the peak for the current cycle was indeed set on January 26, 2018 than we may not get confirmation of a bear market until January of 2019 if history were to repeat. Note: The most widely-used definition of a bear market is a 20% decline so if the peak was indeed set in January of 2018 the S&P 500 would need to close below $2,298.30 before a bear market can be confirmed. That’s 18% lower from the current level.
So why do I think the market may have already peaked for this cycle? Below I’ve pasted some historically-reliable signals indicating the potential we may already be in a bear market. Background: The S&P 500 closed at an all-time high on January 26th, 2018 at $2,872.87. As I write this almost six months later, the S&P 500 trades at about 2,800 and has been unable to overtake the January peak.
Net Worth to Disposable Income versus Market Peaks
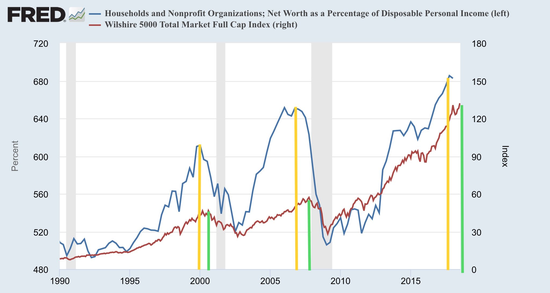
In this chart we see that, historically, household net worth to disposable income (blue line) peaks before market peak (red line) and markets peak before economic recessions (grey shaded region on chart).
Unemployment Rate
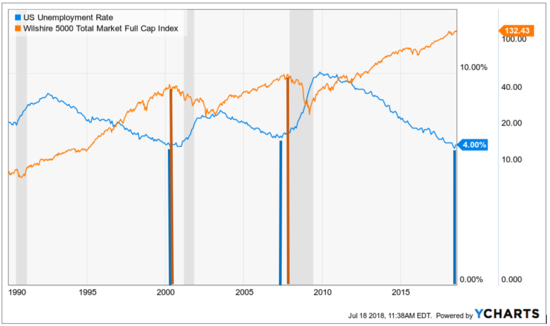
Here we see that the unemployment rate (blue line) tends to bottom immediately before market peaks (orange line) and official recessions (grey shaded region).
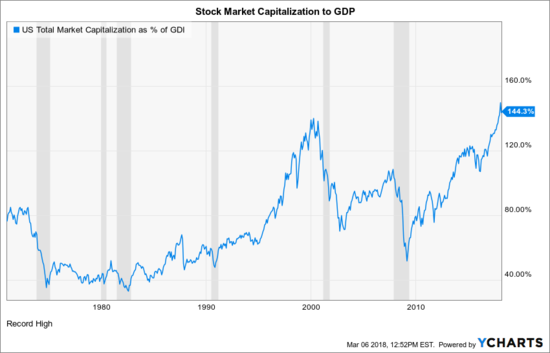
Market Valuation
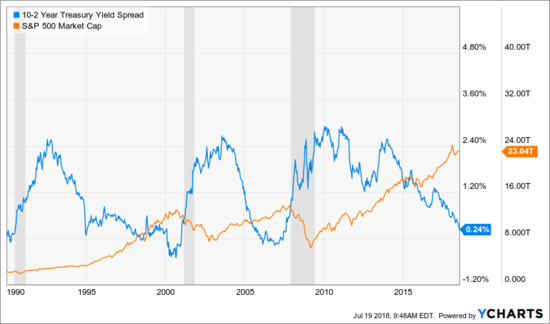
Yield Curve relation to Recessions and S&P 500
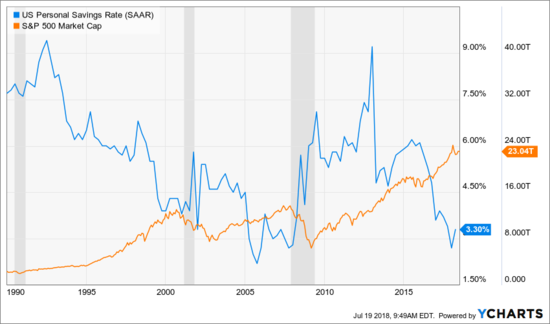
Personal Savings Rate
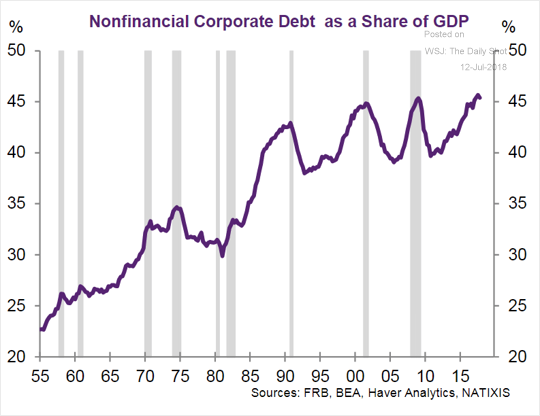
Corporate Debt to GDP (click on image for link to source)
Past performance is not a guarantee of future results.
Many factors influence asset prices in addition to just these few charts. This is not intended as personalized investment advice but general education. Speak to me, Ken Melotte, for a personalized plan and investment strategy for your unique circumstances.
