
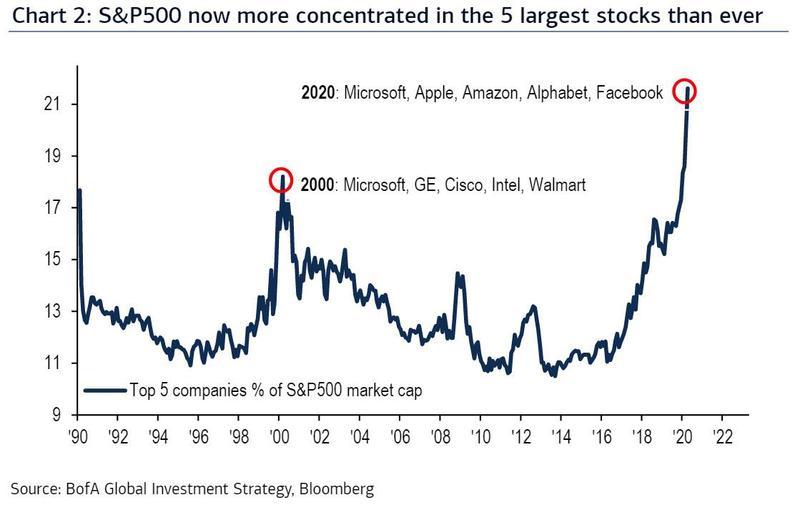
The S&P 500 is now more concentrated than ever before with the largest five companies now accounting for over 21% of the entire S&P 500 (by market cap)! Those top five stocks are Microsoft, Apple, Amazon, Alphabet and Facebook.
The concentration recently surpassed the previous record from the year 2000, which amounted to approximately 19%. In 2000, the five largest stocks were Microsoft, GE, Cisco, Intel and Walmart.
I was curious to see the performance of the top 5 stocks from 2000 onward to see how the returns of those top 5 stocks stacked up. So, I created a custom portfolio including just those five stocks weighted equally (20%) with no rebalancing. Here are the returns for that custom portfolio from 12/31/1999 onward for various time periods.

As you can see, both the absolute and relative returns were awful. Over the next five years through 12/31/2004, that custom portfolio lost 62% even as the broad market was down only 11%. From 12/31/1999 through 12/31/2019, the custom portfolio made just 34.8% while the S&P 500 made over 224%!
Then, I became curious to see if periodic rebalancing would have had any impact on the returns so I reran the analysis assuming annual rebalancing. Turns out the returns were better but still experienced severe losses and significantly underperformed the S&P 500.

So, there you go. The under-performance makes sense. After all, the massive returns that created the high concentration in the first place were likely based on impressive business growth in a “bubbly” market. It’s not likely those earlier rates of growth are sustainable forever so when the market bubble pops the stocks hurt the most are likely those whose returns were most disconnected from the fundamentals.
What does it mean? Past performance is no guarantee of future results, however, if your portfolio is highly concentrated in one or a few of those largest five names (Microsoft, Amazon, Facebook, Apple, Alphabet) you may want to at least reconsider your allocations and see if they still make sense. Review the valuations in the context of various scenarios for future revenues and earnings.
By the way, if you’re curious to see risk metrics for the custom portfolio, I’ve included those here as well:
Risk Info for Custom Portfolio (No Rebalancing)

Risk Info for Custom Portfolio (Annual Rebalancing)

Disclosures:
Past performance is no guarantee of future results. All investments maintain risk of loss in addition to gain.
Data from third-parties is believed to be reliable but accuracy is not guaranteed. Much of the data used to interpret the markets and forecast returns are often at odds with each other and can result in different conclusions. Many different factors impact prices including factors not mentioned here.
This is NOT investment advice but merely a general commentary. Individualized investment advice cannot be provided until a thorough review of your unique circumstances and financial goals is completed.
Views provided here are current only as of the moment of posting and are subject to change at any time without notification.
