
Executive Summary: The price you pay for an asset determines your return.
I came across this chart over the weekend from @OddStats. The chart shows the returns of the S&P 500 by decade.
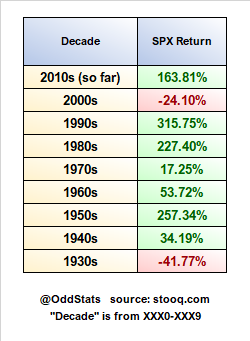
The first observation someone might make is that the market is up more often than it is down. That is certainly true, especially when looking at 10-year time periods.
Looking deeper we see that four of the nine decades produced impressive triple-digit returns, three produced sub-par double-digit returns and two of the decades produced negative returns.
Because the market is up far more often than it is down many people conclude, therefore, it’s appropriate to be positioned aggressively at all times. After all, the market always comes back, right? That’s where folks start getting themselves in trouble.
Folks with very long time horizons (very wealthy families, young workers, etc…) can afford to be very aggressive with their investment strategy, but most folks must start withdrawing from their portfolio at some point (or are already withdrawing) to support their retirement, kids’ college expenses, health care needs, etc…
Since most of people must eventually fund their life from their investments, the sequence of returns is extremely important and, if not managed properly, can destroy their one shot at a comfortable retirement. I’ve written about this concept (Sequence of Returns Risk) several times in the past here, here, here and here.
Although this is not the point of this commentary, but let me provide one brief, over-simplified example -> Imagine your ability to retire and maintain your lifestyle hinges on a 7% annual return assumption. At that rate, your portfolio doubles every ten years. So a $2 million portfolio grows to $4 million after a decade. But, then imagine, instead, your returns fall short causing your portfolio to actually lose 20% over the next decade. Instead of having $4 million at retirement you’re left with just $1.6 million, or $2.4 million less than you planned! That would have a MAJOR impact on your retirement plans / lifestyle. For most people, it may cause them to have to work much longer than planned, or go back to work, and / or drastically reduce spending in retirement.
But that is not the point of this commentary. What I really wanted to point out today is the relationship between each decade’s returns and the valuation of the market at the start of each decade.
After all, the price you pay for an asset largely determines the return. For example, if you pay $90 for $100 of cash flow in ten years your return will be about 11%. If, instead, you pay $50 for that same $100 cash flow your return will be 100%.
The next chart from Dr. John Hussman illustrates one of the most reliable valuation metrics of the U.S. stock market going all the way back to 1929 on the eve of the Great Depression. This helps us better understand the price we are paying for U.S. stocks today relative to history.
First, take another look at the chart at the beginning of this email. Take note of both the strong and weak decades.
Now, look at the chart below. Notice how high the valuations were at the beginning of the worst decades (1930s, 1970s, 2000s). Then notice how low the valuations were at the start of the best decades (1950s, 1980s, 1990s). The price you pay determines your returns!
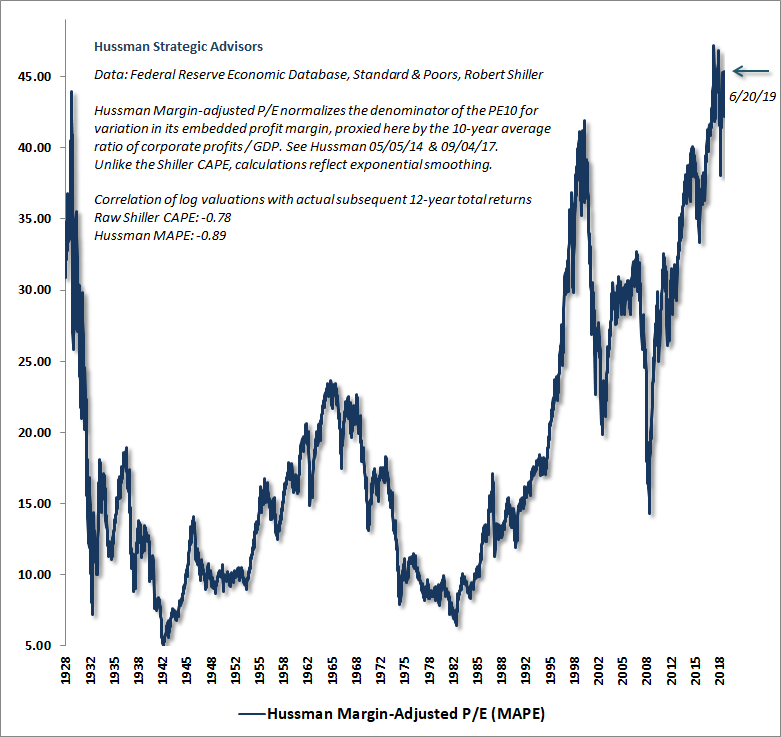
Now that we understand the connection between valuations and subsequent returns, observe where valuations stand currently. They are at a historic high exceeding even the Great Depression and Dot-Com Bubble peaks.
So, based on this information, do you believe the next decade is more likely to produce 200%+ returns or flat-ish returns?
Why do I believe it’s important to share this information?
- I want to help people avoid the mistake of running into the fire. In other words, I’m trying to help people avoid the common mistake of having excessive stock exposure near a cyclical peak when valuations are at extremes and 10-year forward return prospects are poor.
- It’s important for financial / retirement planning to use realistic return assumptions otherwise the projections, and any decisions that flow from those projections, are garbage. It’s critical to understand the drivers of returns in order to make realistic return assumptions.
- It’s important to understand the risk-return potential of various markets around the globe. Which assets should be avoided or reduced and which should be targeted?
- It’s important to see the big picture. It’s easy to become distracted by noise over the short-term. However, we invest for life, not for the next week, month or even year.
- It’s important to remember that short-term movements in markets are not predictable. However, there are time-tested metrics that have been reliable in projecting 10-12 year returns, which essentially encompasses a full market cycle. Any short-term predictions are unreliable and misleading. There is no metric that has consistently predicted short-term returns. This is why my approach is largely focused on the full market cycle.
It may be time for a complimentary portfolio review and, potentially, an adjustment to your investment strategy. Contact me at ken@melottefa.com to get started with the free portfolio review.
Past performance is no guarantee of future results. This is not intended as specific investment advice but as general education. Data from third-parties is believed to be reliable but accuracy is not guaranteed. There are many factors that can impact market returns.
